> For the complete documentation index, see [llms.txt](https://docs.sprinto.com/llms.txt). Markdown versions of documentation pages are available by appending `.md` to page URLs; this page is available as [Markdown](https://docs.sprinto.com/monitors/cloud-and-infrastructure-monitoring/oracle/how-to-resolve-sprinto-check-for-monitoring-active-connection-count-on-oracle-cloud-load-balancer.md).
# How to resolve Sprinto check for monitoring active connection count on Oracle Cloud Load Balancer
### About
Sprinto check: Active connection count of a load balancer should be monitored
Monitoring the active connection count on Oracle Cloud is crucial for managing resources, optimizing performance, and ensuring smooth operations of your cloud-based applications and services.
### Purpose
The purpose of monitoring active connection count on Oracle Cloud is to:
1. Resource Management: Gain insights into resource utilization and capacity planning by monitoring the number of active connections to your Oracle Cloud services.
2. Performance Optimization: Identify potential bottlenecks or performance issues by tracking fluctuations in active connection count and taking proactive measures to optimize resource allocation and application performance.
3. Operational Efficiency: Ensure operational efficiency and reliability by monitoring active connection count in real-time, detecting anomalies, and responding promptly to mitigate potential disruptions or service degradation.
### How to resolve
Follow the below steps to create a monitoring alert on the Oracle Cloud Load Balancer:
#### Before you begin
* Ensure you have “Admin” access to the Oracle Cloud account where you wish to perform the following action.
#### Modifying internet access
1. Log in on[ Oracle Cloud](https://www.oracle.com/in/cloud/sign-in.html) using your credentials.
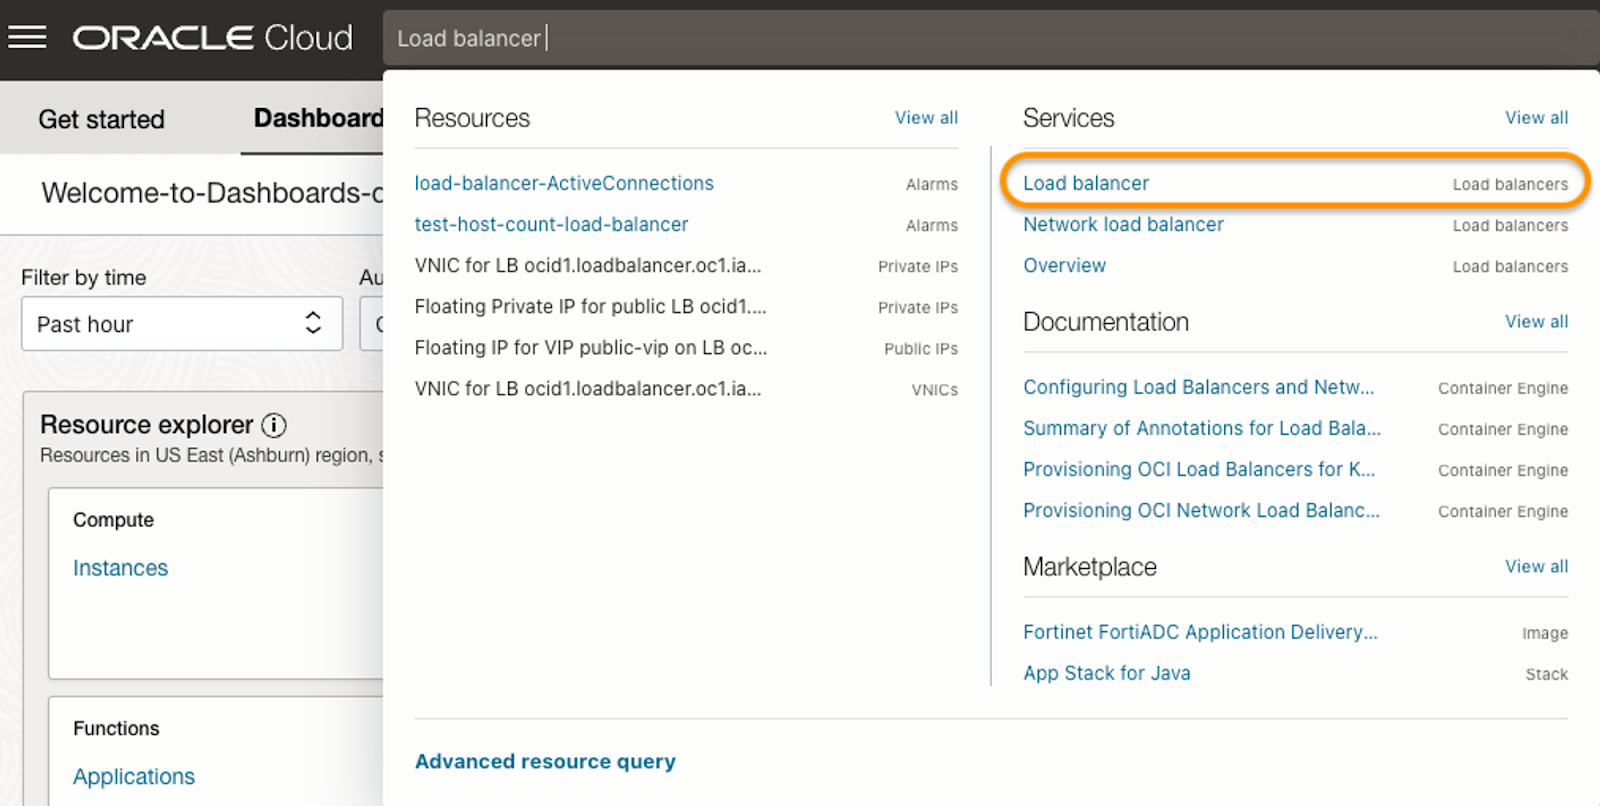
2. Navigate to the Load balancer service.
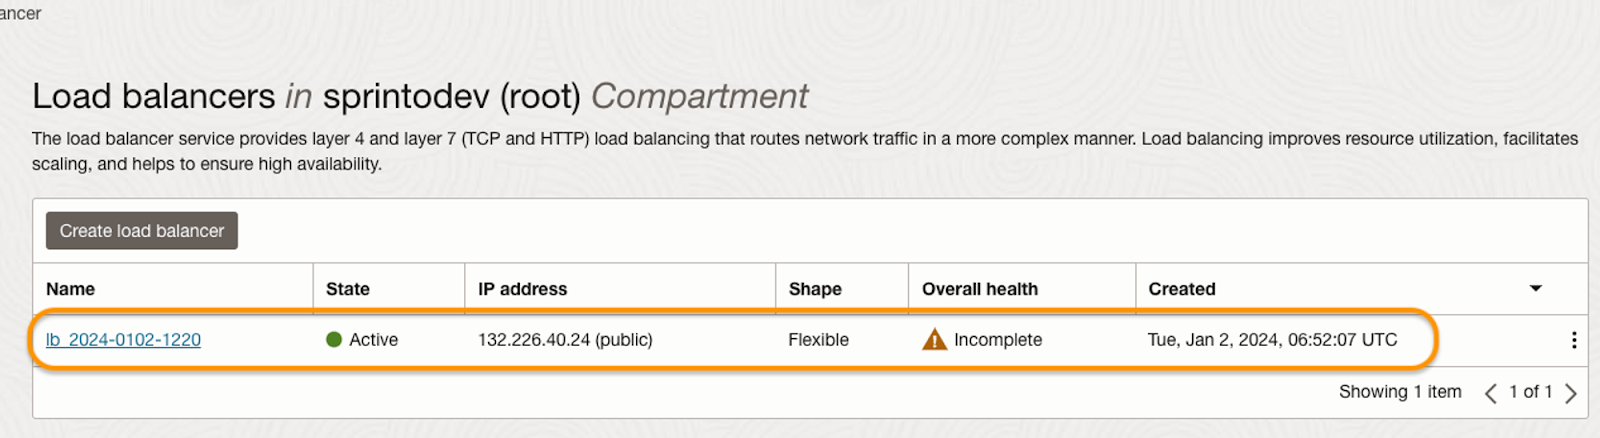
3. Select the load balancer for which you wish to create the monitoring alert.
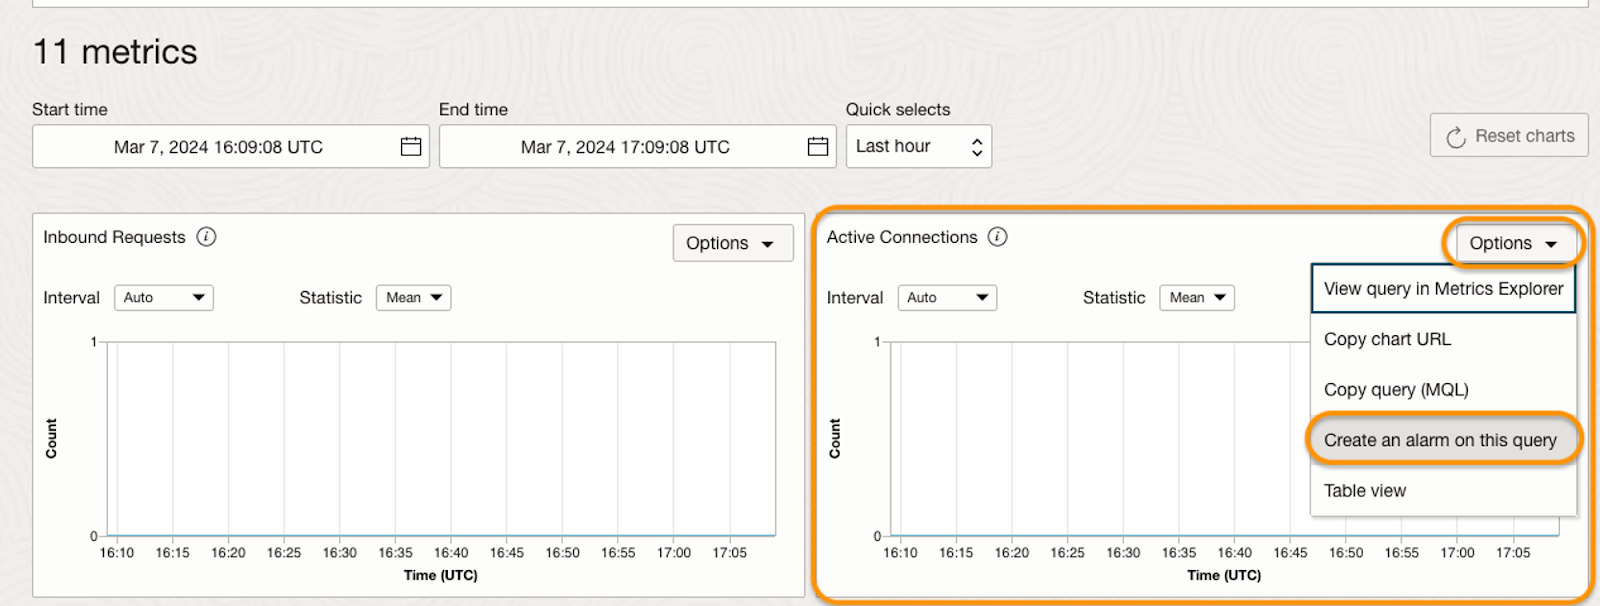
4. Click Create an alarm on the query for the Active Connections metric.
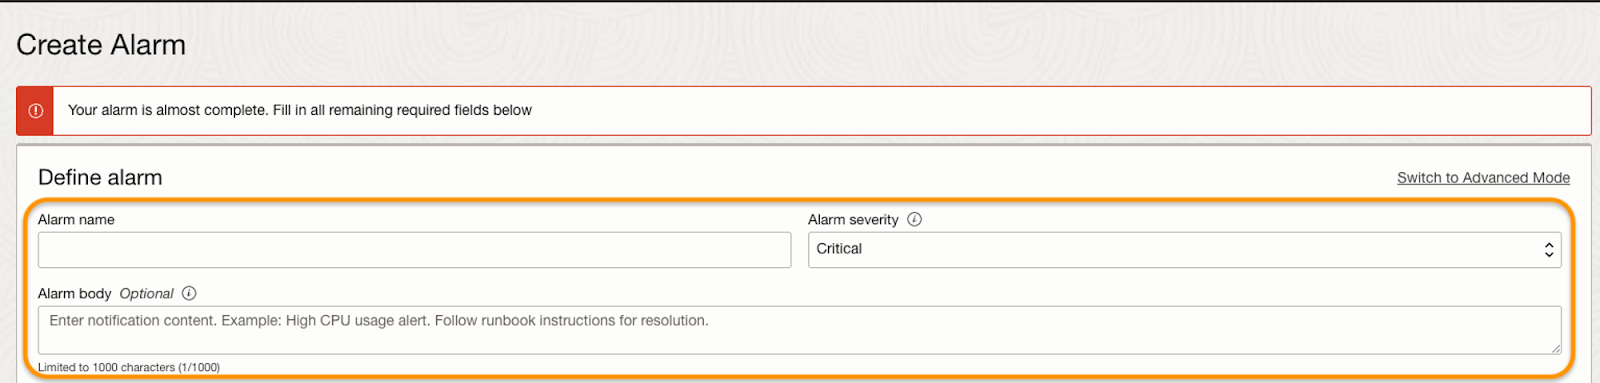
5. On Create Alarm page, enter Alarm name and describe the alarm purpose in brief.
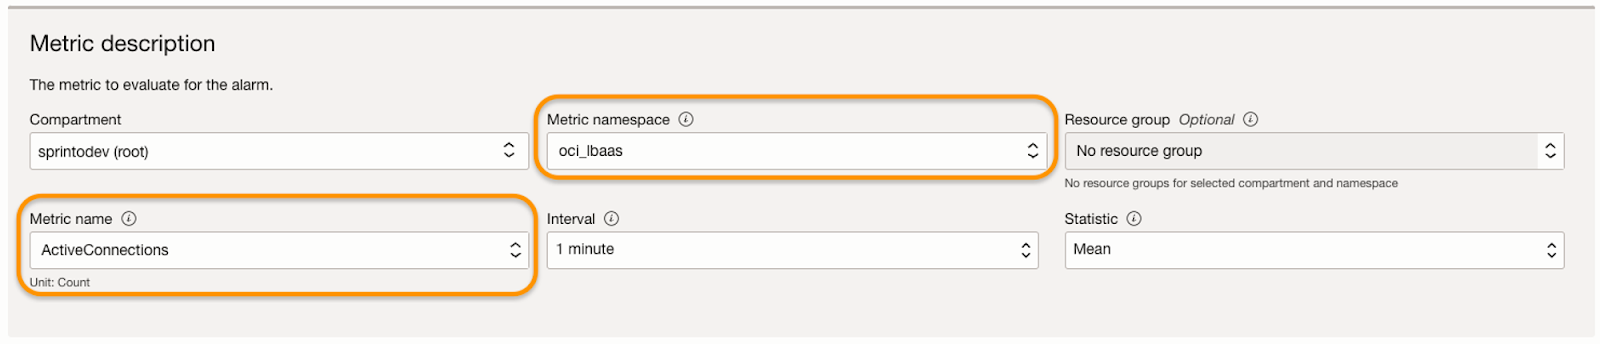
6. Ensure the following metrics are selecter:
* Metric Namespace: oci\_ibaas
* Metric Name: ActiveConnections
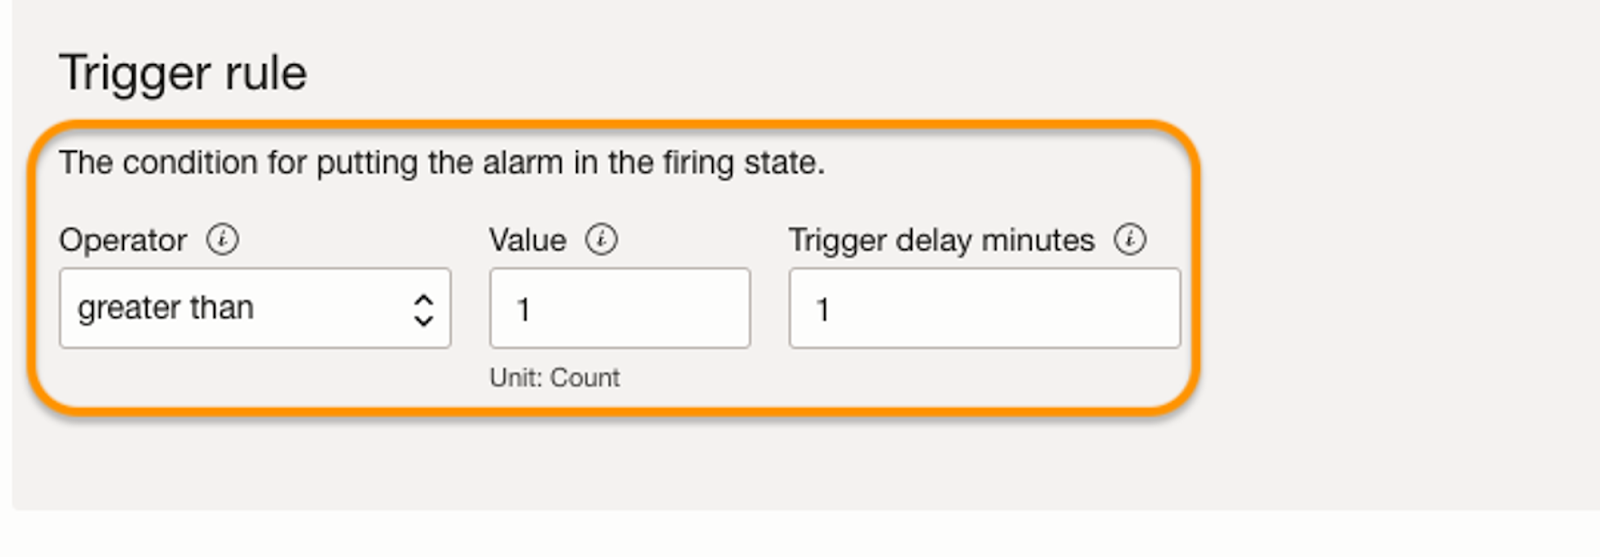
7. Define the alert trigger point.
8. Define the alarm notification by selecting your previously created topic. If you don’t have a topic created, you can Create a topic.
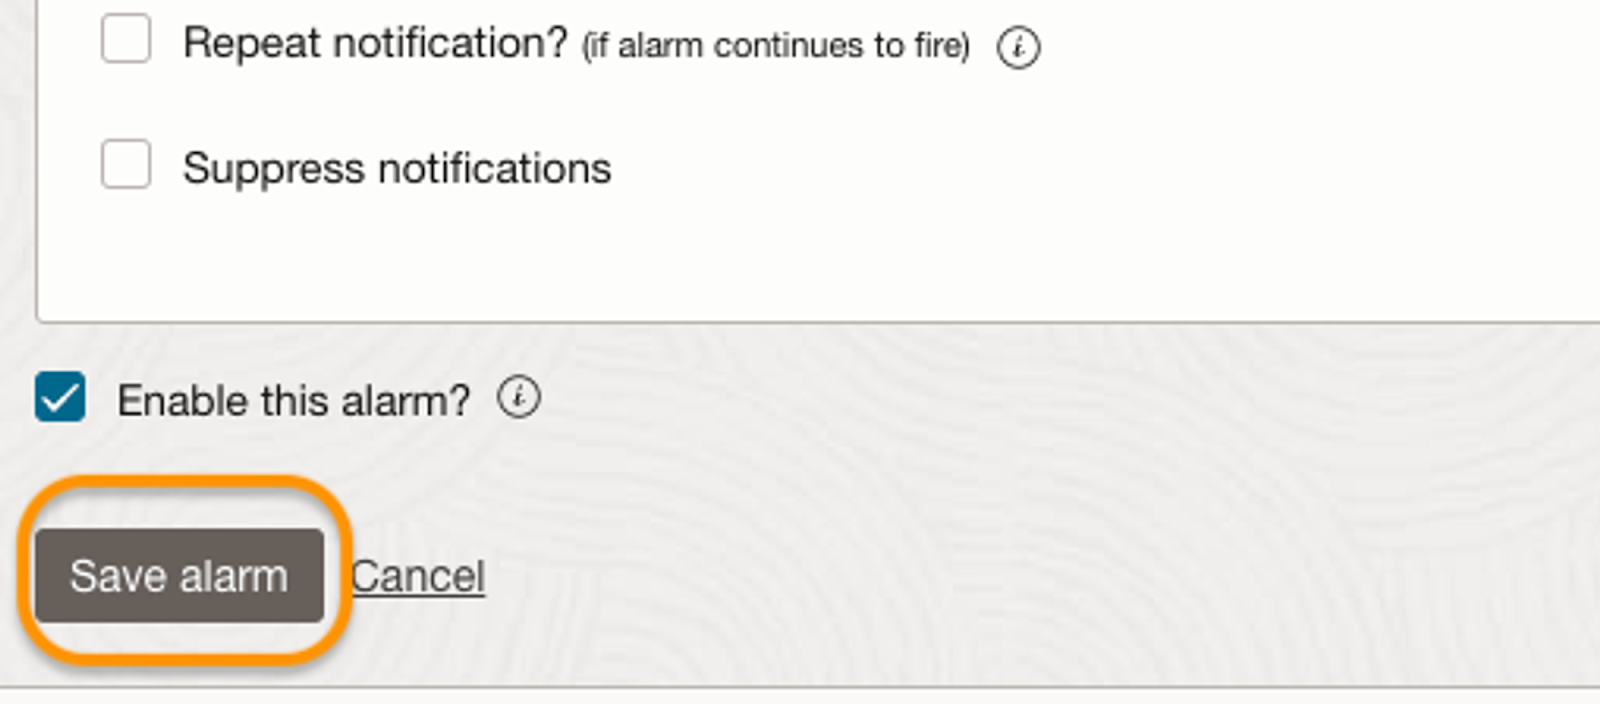
9. Review your selections, and click Save alarm.
Once the alert is created, Sprinto retrieves the change from your integrated Oracle Cloud account on Sprinto, and sets the assigned check status to "Passing."
If you need any assistance with the Sprinto check, please contact [Sprinto Support](mailto:www.support@sprinto.com).
---
# Agent Instructions
This documentation is published with GitBook. GitBook is the documentation platform designed so that both humans and AI agents can read, navigate, and reason over technical content effectively. Learn more at gitbook.com.
## Querying This Documentation
If you need additional information that is not directly available in this page, you can query the documentation dynamically by asking a question.
Perform an HTTP GET request on the current page URL with the `ask` query parameter, and the optional `goal` query parameter:
```
GET https://docs.sprinto.com/monitors/cloud-and-infrastructure-monitoring/oracle/how-to-resolve-sprinto-check-for-monitoring-active-connection-count-on-oracle-cloud-load-balancer.md?ask=&goal=
```
`ask` is the immediate question: it should be specific, self-contained, and written in natural language.
`goal` is optional and describes the broader end goal you are ultimately trying to accomplish on behalf of the user. GitBook uses it to tailor the answer towards what is most useful for that goal.
The response will contain a direct answer to the question and relevant excerpts and sources from the documentation.
Use this mechanism when the answer is not explicitly present in the current page, you need clarification or additional context, or you want to retrieve related documentation sections.